%20Gradient%20%E2%80%94%20light%20to%20dark.png)
“Core collapse”, or the inward deformation of a jellyroll into the void space at its center, is a common cylindrical cell failure mode that can cause capacity loss, internal short circuits, and even thermal runaway. CT imaging is excellent at showing the geometry of this deformation: you can clearly see a collapsed core in a scan. And while many previous works have periodically CT scanned cells over the course of a cycling experiment, using this type of dataset to quantify and illustrate local strain has not been previously attempted.
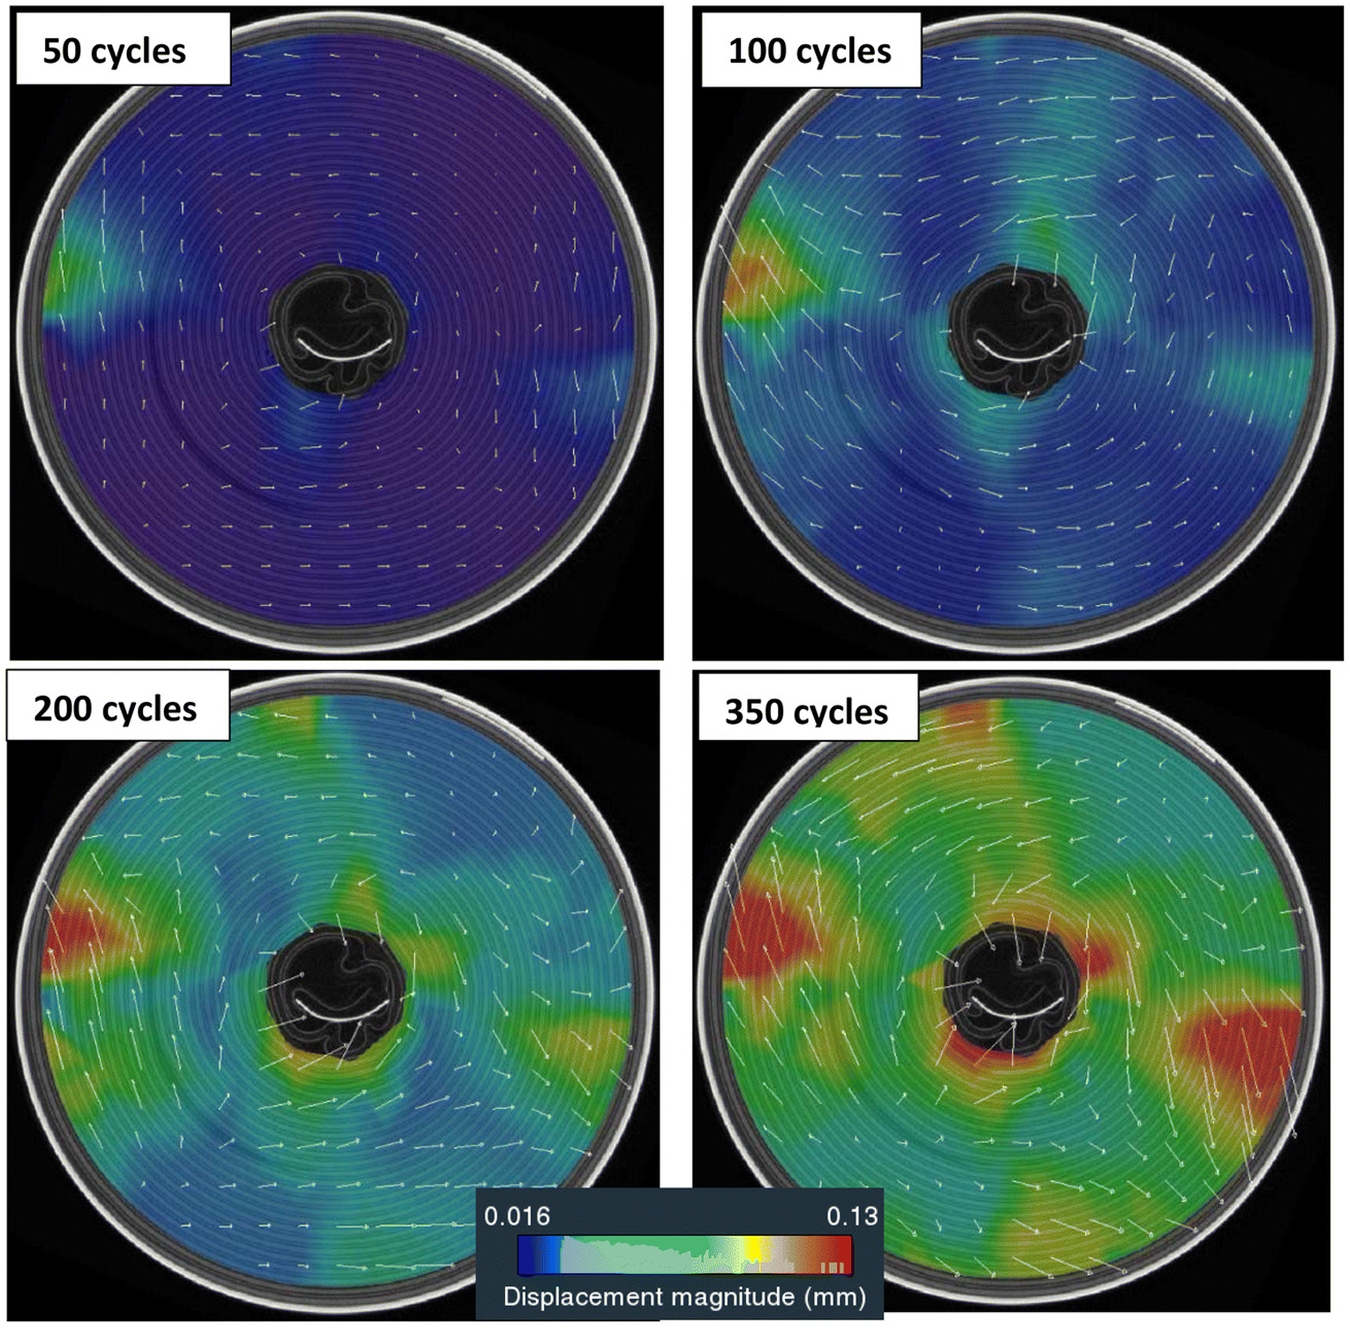
CT-derived strain maps reveal distinct bands of expansion and contraction that grow and propagate inward over hundreds of cycles; the swelling is far from uniform. Reproduced from Figure 9 of Madi et al.
Understanding the dynamics of core collapse motivated Glimpse’s work with Kamel Madi and colleagues at 3Dmagination, just published in EES Batteries. The paper, entitled “Coupling X-Ray Computed Tomography with Digital Volume Correlation to Study Core Collapse in Lithium-Ion Batteries,” can be read here.
To understand the mechanics of this failure mode, we paired CT imaging with digital volume correlation (DVC), a technique that tracks how features in CT volumes move between scans to produce quantitative 3D displacement and strain maps. DVC enables an understanding of structural deformation over time (and creates beautiful graphics in the process).
The results revealed a clear picture of the drivers of core collapse. Large tensile strains develop around geometric inhomogeneities, such as the positive tab and internal kinks, before spreading inward. Expansion and contraction propagate in distinct vertical bands radiating from the casing toward the core, and the onset of buckling could be directly linked to compressive hoop strains and radial tensile strains. In these cells, the displacement of the inner negative tab emerged as a strong indicator of core collapse progression.
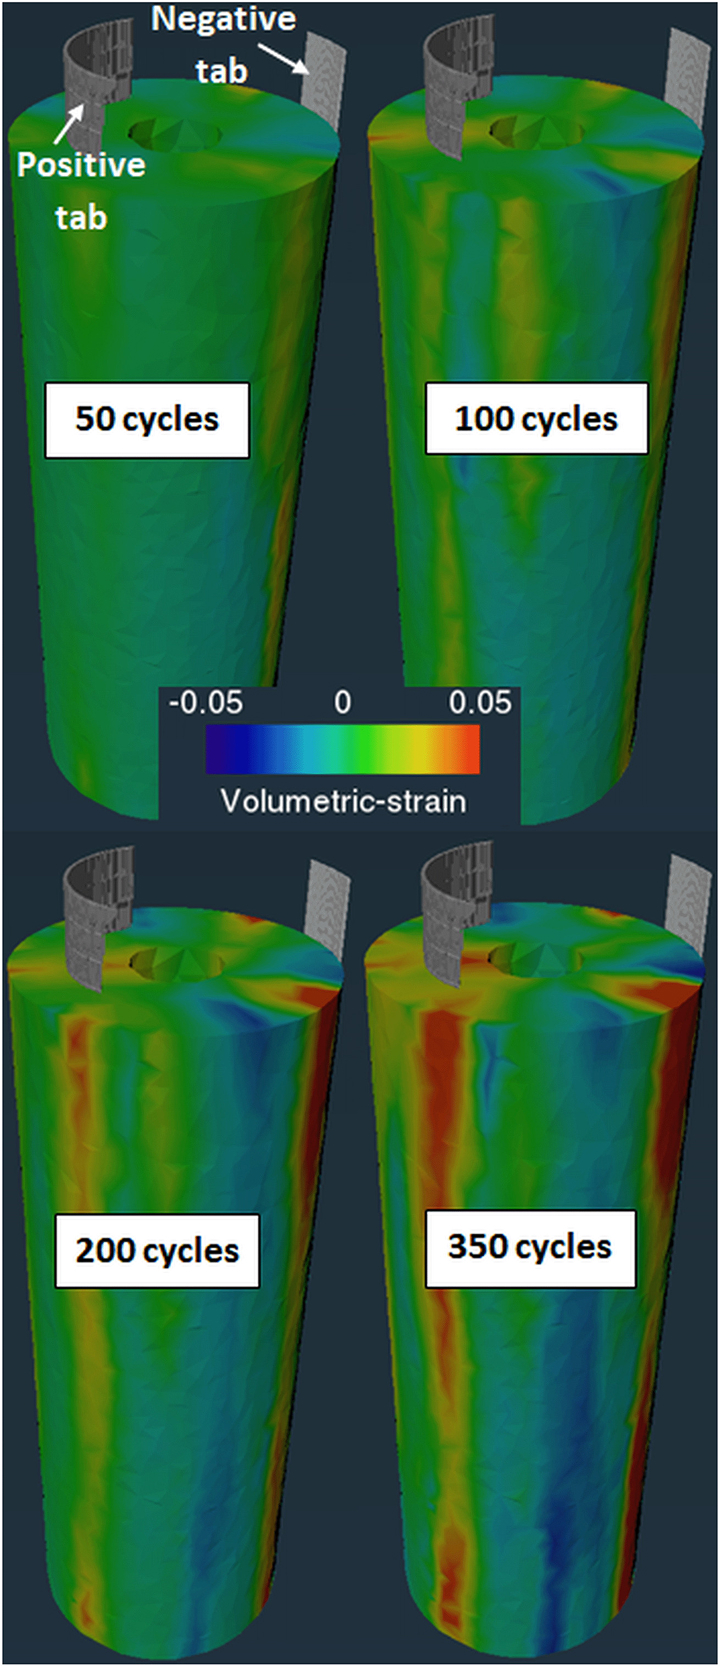
Strain maps of a cylindrical cell jellyroll deforming during cycling. The displacement is concentrated near the positive tab and innermost layers, spreading inward in bands as the cell ages. Reproduced from Figure 7 of Madi et al.
CT scanning provided the 3D imaging foundation that made this analysis possible, and Glimpse enables the scan throughput and image quality needed to apply this kind of characterization at scale. Contact us to leverage high-throughput CT scanning for your own cell development and qualification needs.