Contact Us
Service
Service

Scan On Demand

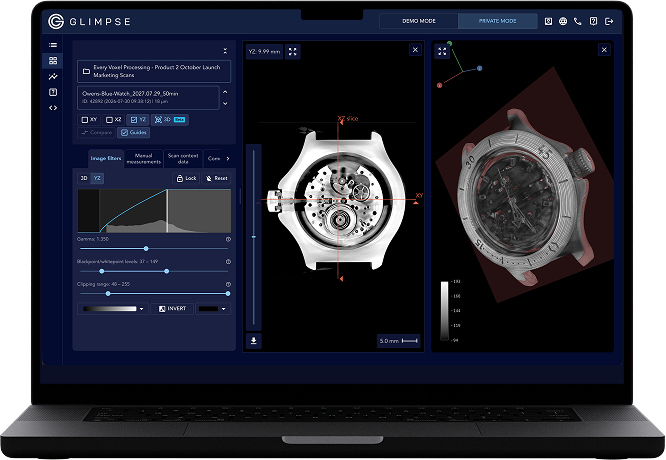
Ship us a part. We CT scan it and hand back the results in your browser — no scanner, no capital expense.
HOW IT WORKS
01
You ship it
Get quote, put your part in the mail
02
We scan it
We produce high-resolution CT scans
03
Review, measure, share
All in the Glimpse Portal
Get a scan quote
Tell us what you need scanned and we will come back with a price.
Talk to an engineer
Contact Us
Image

The Glimpse Portal • Battery

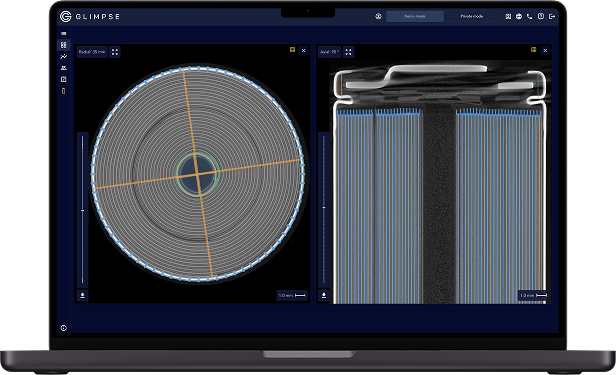
CT-powered cell quality management solution, built by battery experts

Whether you’re a cell producer, a cell buyer, or both, our Battery package lets you experience the full scope of Glimpse’s end-to-end cell CT scanning solution deployed at your facility. Powering some of the largest gigafactories in the world.

CT scanning for batteries

Why choose X-ray CT scanning for battery quality control?

Image

A dent in the can, a negative anode overhang, a tear in the tab, a buckled jellyroll...

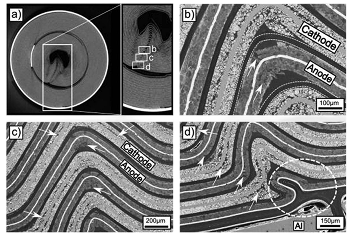
Battery defects come in a variety of shapes and sizes and can reside in any part of the cell. In many instances, these defects are latent, which means that they are initially imperceptible to standard electrical characterization techniques. By generating a high-resolution map of the cell's internal structure, X-ray computed tomography (CT) scanning makes it possible to create a comprehensive assessment of a battery’s manufacturing quality.

A common misconception is that CT scanning is too slow and expensive to be compatible with gigawatt-hour scale battery production and assembly environments. That’s where Glimpse comes in.

High-throughput scanning

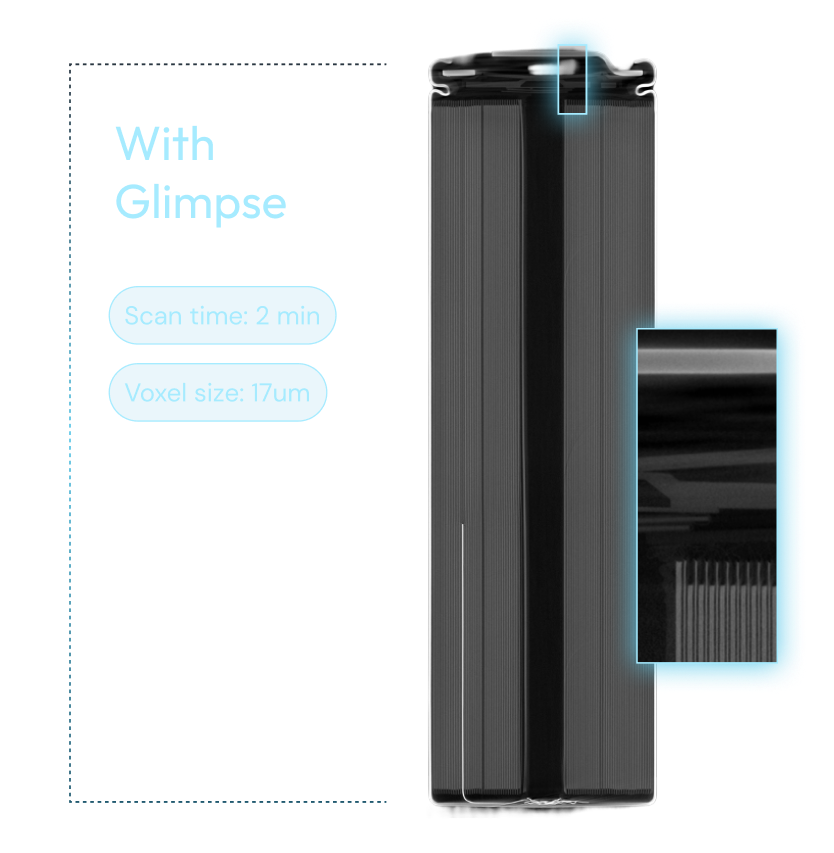
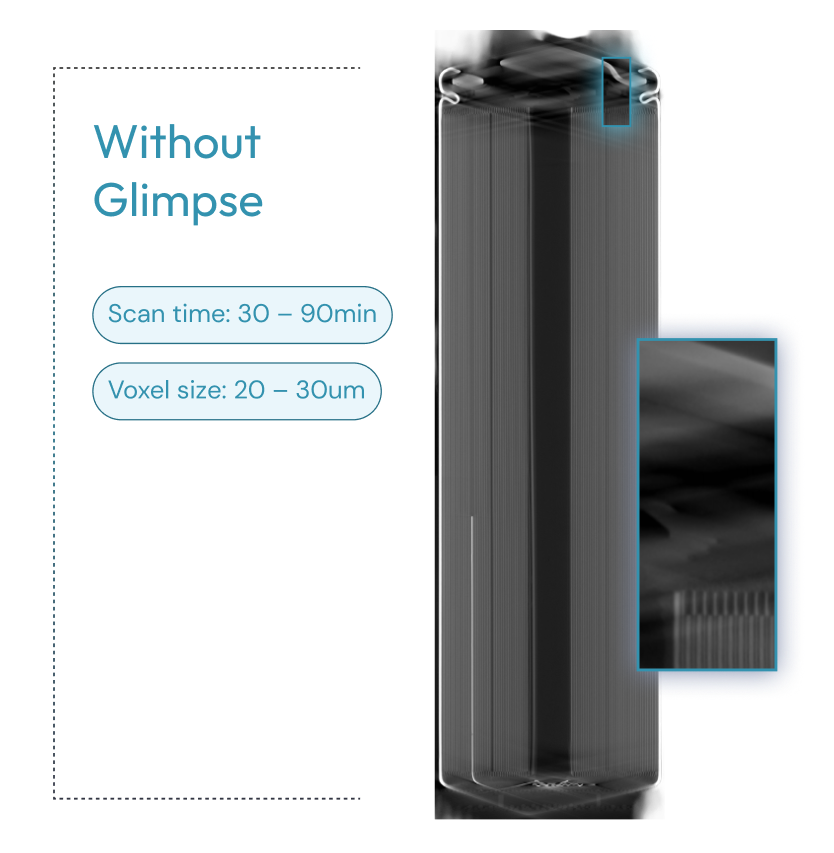
10 to 30x scan time reduction without sacrificing image quality

Speed up cell CT with our high-throughput scanning module and build a digital fingerprint of your cell quality.

Increase sampling rates to hundreds of cells per day and beyond, prevent defect escapes, shorten root causing from weeks to hours, and reduce physical tear downs.
Image
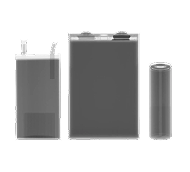
We support all cell form factors:
Pouch, prismatic, and cylindrical.
ImageImage

Generalized inspection algorithms

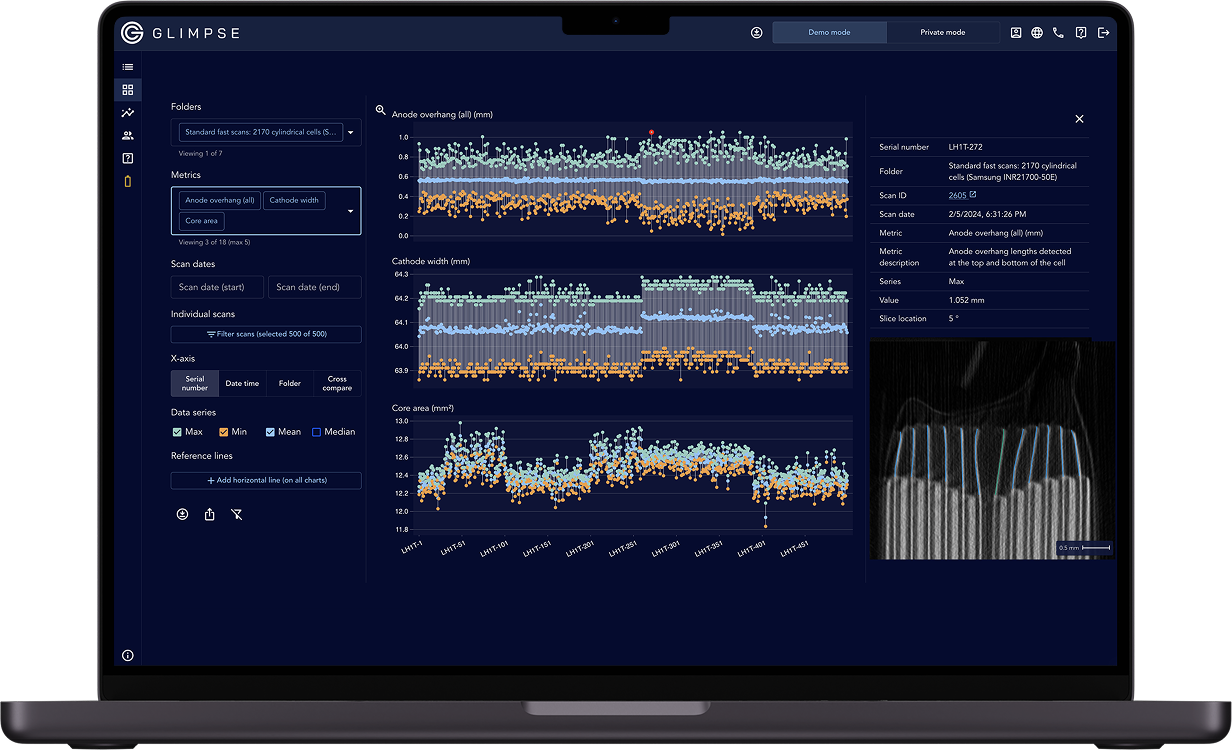
Control your cell quality with our full suite of inspection algorithms

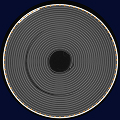
Anode overhang, cathode width, core circularity, can denting, crimp height, and many more. Our team has developed a suite of generalized cell inspection algorithms by collecting millions of cross sections from the world's most diverse dataset of cell designs.
Image

For cell teams working on:

Cell development
Cell qualification
Gigafactory ramp-up
Mass production
Incoming quality control
Fleet failure management

What computer vision algorithms do we support?

Automated inspection algorithms for batteries

This section describes Glimpse's standard automated inspection algorithms. Our standard algorithms are mostly targeted at cylindrical cells, but we support inspection algorithms for all cell form factors and even samples other than battery cells. Glimpse can develop bespoke inspection algorithms upon request. Contact us to discuss further.
Core
Core shape
Core buckling
Core impingement
Can
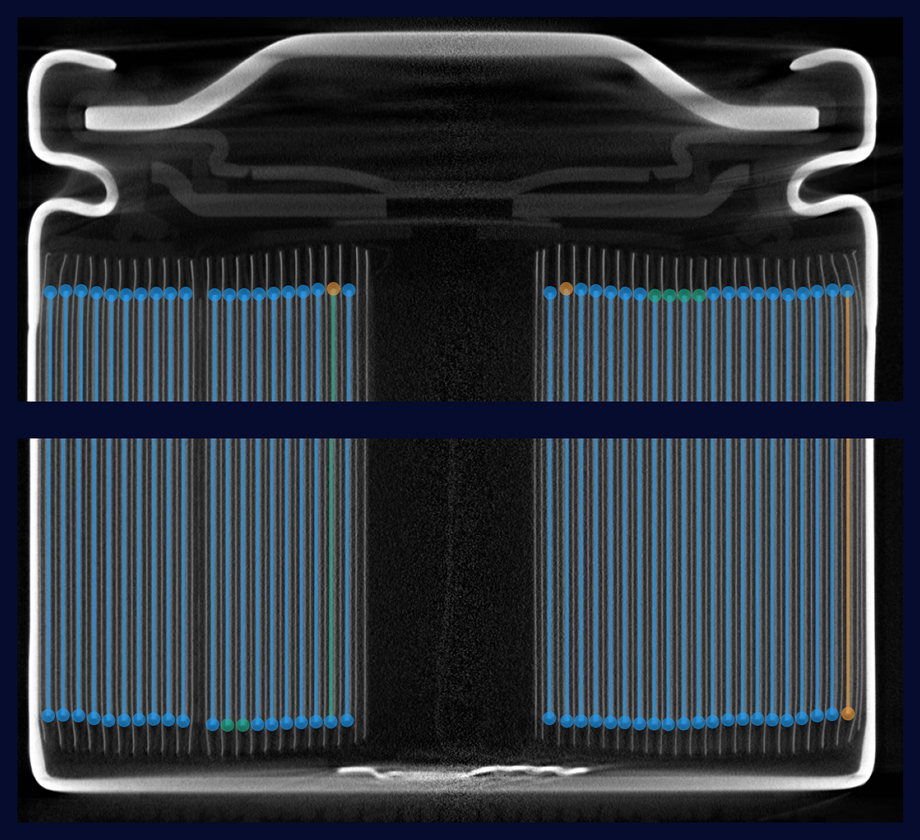
Anode overhang
Cathode width & positions
Crimp

Core shape

What we track

Area & effective diameter

Defined by the area captured by the inner contour of the innermost cathode wrap and the diameter of the corresponding circle

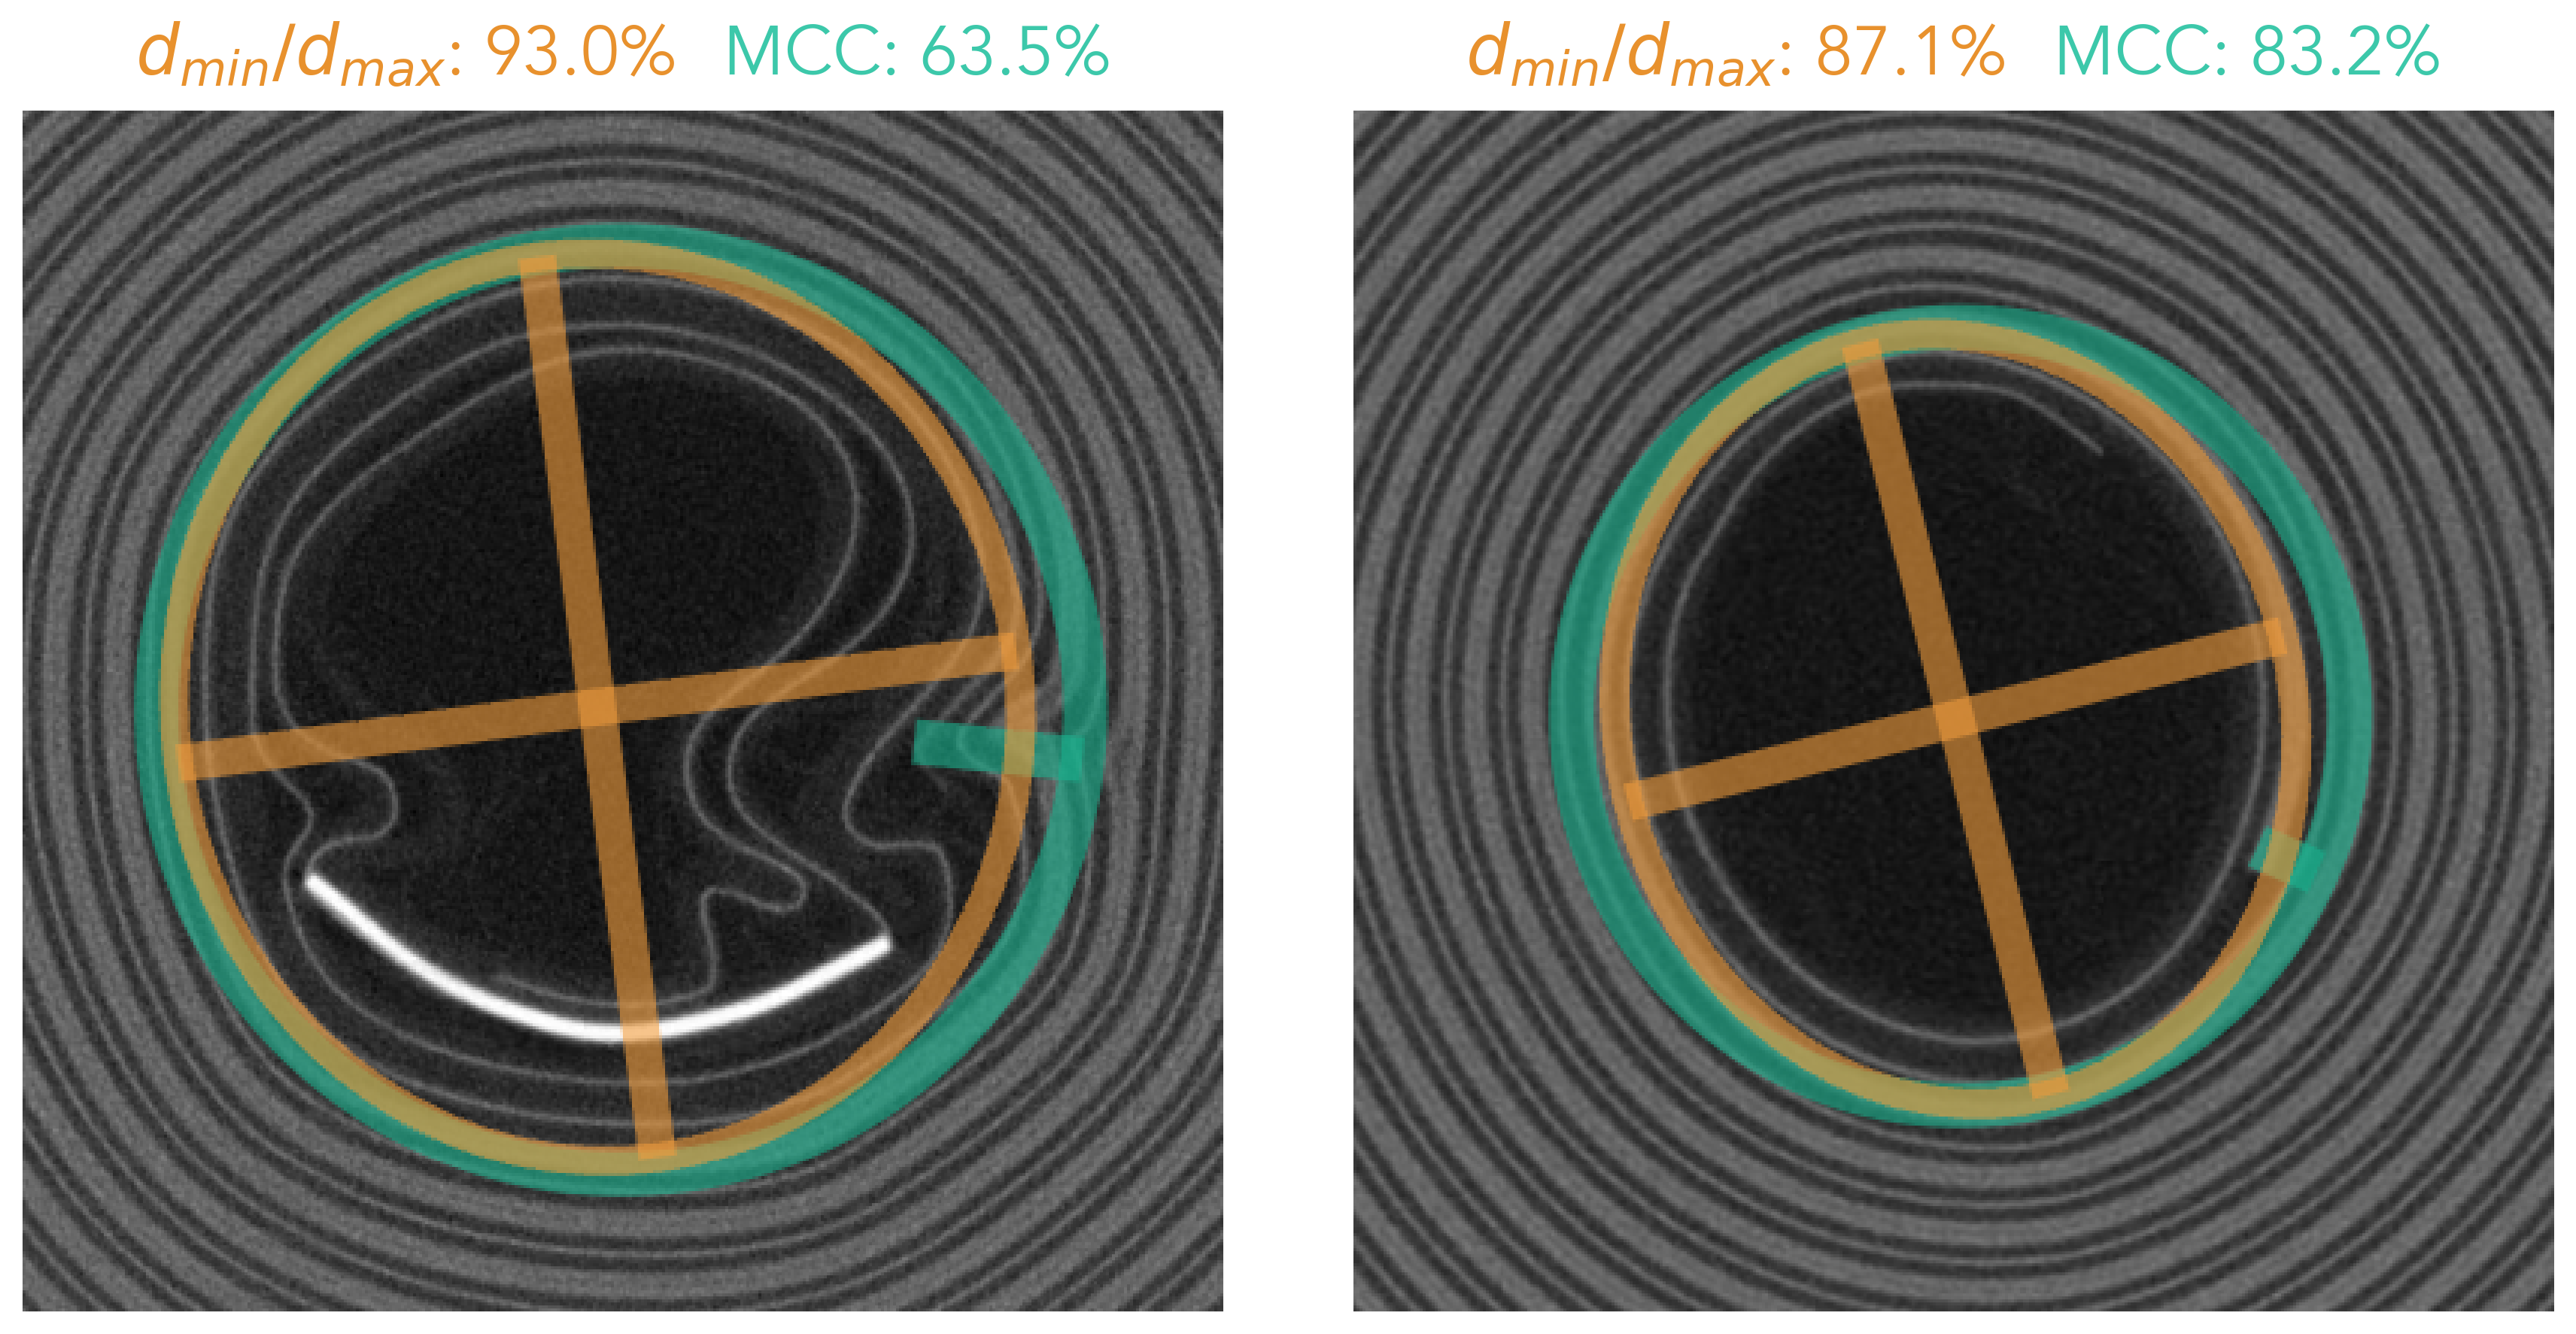
Circularity, MCC

Defined by maximum inward deviation from a minimum circumscribed circle (MCC). This metric identifies flat spots in the core

Circularity, d_min/d_max

Defined by eccentricity (min diameter / max diameter, or d_min/d_max). This metric identifies oval-shaped cores

Concentricity

Defined by the distance from the center of the can to the center of the core. This metric measures the centeredness of the jellyroll within the can

Note that we have two different core circularity metrics:

d_min/d_max and MCC. These metrics are complementary and can identify different types of circularity issues (see details below). Neither metric will approach 100% since jellyrolls are actually spirals; for instance, the maximum MCC value we observe in practice is ~93%.
Image
Image
Area & Effective Diameter
Image
Circularity, dₘᵢₙ/dₘₐₓ
Image
Circularity, min circumscribed circle (MCC)
Image
Concentricity
How/where it is measured

Cylindrical cells:

Measured in every radial cross section from top to bottom of the jellyroll
Why it matters

Area & effective diameter

Large core area increases core buckling risk. Core area also serves as an indicator of jellyroll swelling over life¹

Circularity, MCC

Poor core circularity increases core buckling risk. The MCC metric can identify flat spots in the core, which are often hotspots for buckling initiation ²ʼ³. For cells with core buckling, MCC also measures the extent of buckling

Circularity, d_min/d_max

Poor core circularity increases core buckling risk. The d_min/d_max metric can identify oval-shaped cores, which are less resistant to buckling than circular cores

Concentricity

Off-centered jellyrolls have a higher risk of experiencing failure in high-vibration environments⁴

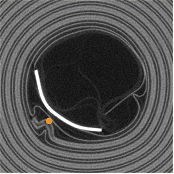
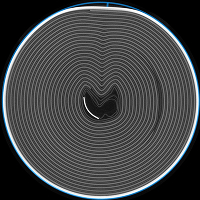
Core buckling

What we track

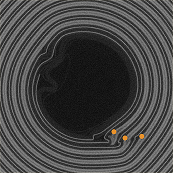
We classify each image into three categories:

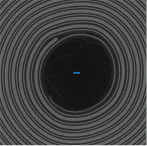
  • Level 0: No core buckling
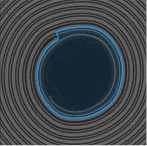
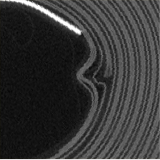
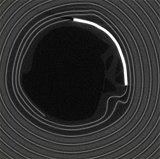
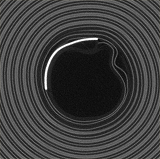
  • Level 1: Marginal core buckling, defined by the presence of any negative curvature of the cathode wraps
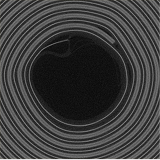
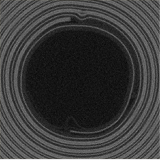
  • Level 2: Core buckling, defined by the presence of significant negative curvature of the cathode wraps
We also report the number of buckled cathode wraps. This metric is a more granular measure of core buckling severity than our three-level classification.

These metrics are highly correlated but complementary:

For instance, a cell with 1 buckled wrap may be classified as Level 2, while a cell with 3 buckled wraps may be classified as Level 1.

These levels aren't an exact science; in practice, the boundaries between these levels are fuzzy. For instance, the above image with 8 buckled wraps could be considered to have 9 buckled wraps.
Image
Level 0: No core buckling
Image
Level 1: Marginal core buckling
Image
Level 2: Core buckling
Image
2 buckled wraps
Image
5 buckled wraps
Image
8 buckled wraps
Image
Image
How/where it is measured

Cylindrical cells:

Measured in every radial cross section from top to bottom of the jellyroll
Why it matters
Core buckling is an internal shorting risk via either localized lithium plating, separator puncture via the cathode, or both. Some references: ¹ ² ³ ⁴
Image
Glimpse has also published some research on “core collapse”. ⁵ ⁶ ⁷

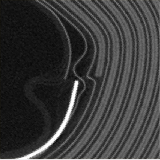
Core impingement

What we track

We classify each image into three categories:

  • Level 0: No core impingement
  • Level 1: Core impingement without cathode tip damage, defined by a sharp angle of the anode at the cathode start point
  • Level 2: Core impingement with cathode tip damage, defined by visible damage to the cathode tip in the presence of core impingement

These levels aren't an exact science

In practice, the boundaries between these levels are fuzzy.

Note that cells with tapered cathodes at the core (see examples below) cannot have impingement by definition. See this Tesla patent¹ for details.
Image
Level 0: No core impingement
Image
Level 1: Core impingement, without cathode tip damage
Image
Level 2: Core impingement, with cathode tip damage
Examples of tapered cathodes at the core
Image
Image
Image
How/where it is measured

Cylindrical cells:

Measured in every radial cross section from top to bottom of the jellyroll
Why it matters
  • Core impingement is an internal shorting risk. See this Tesla patent¹ and this subsequent Tesla patent² for details.
  • Cathode tip damage indicates especially high stress at the cathode start point and thus a higher risk of internal shorting. See slides 19–21 of this presentation³, covering joint work between Glimpse and NASA, for more details.

Can

What we track
  • Mean inner diameter
  • Mean outer diameter
  • Mean wall thickness
  • Circularity, as defined by its eccentricity (min diameter / max diameter, or d_min/d_max). This metric identifies oval-shaped cans
  • Max denting
Image
Inner diameter
Image
Inner diameter
Image
Mean wall thickness
Image
Circularity, d_min/d_max
Image
Max denting
How/where it is measured

Cylindrical cells:

Measured in every radial cross section from top to bottom of the jellyroll
Why it matters
  • Inner diameter & outer diameter: Can diameter is a key cell design specification and an indicator of jellyroll swelling
  • Wall thickness: Thinner can walls increase side rupture risk
  • Circularity, d_min/d_max: Poor can circularity increases core buckling risk
  • Denting: Dents increase core buckling risk. For example, see the dented cell after cycling shown here
Some references on can swelling and deformation: ¹ ² ³
Image
A dented cell after cycling

Anode overhang

What we track
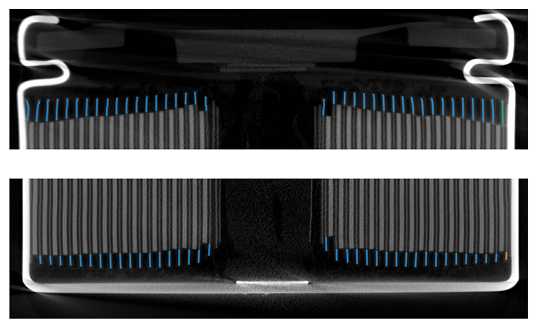
  • Minimum, maximum, mean, and standard deviation of anode overhang within the whole jellyroll, the top of the jellyroll, and the bottom of the jellyroll
  • Anode overhang asymmetry (top/bottom)
  • Anode overhang violations (overhang < 0 mm). Note that you may want to use an overhang threshold >0 mm in practice, but we use a 0 mm threshold here for simplicity. IEEE Std 1725-2021¹, section 5.2.4, suggests a minimum overhang spec of 100 µm.
Image
How/where it is measured
  • Cylindrical cells: Measured at the top and bottom of every axial cross section
  • Pouch and prismatic cells: Depends on the cell design
Why it matters
  • Small or negative anode overhangs (cathode overhanging anode) are a lithium plating risk¹
  • Large anode overhangs can reduce cell capacity and energy by serving as a lithium reservoir²
  • Anode overhang variation indicates poor manufacturing control
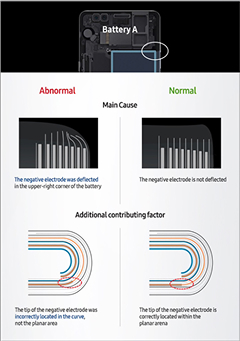
  • We don’t track this today, but bent or deflected overhangs can also be a shorting risk. This issue was responsible for the Galaxy Note 7 failures³
Image
Bent overhang, Galaxy Note 7

Cathode width & positions

What we track
  • Minimum, maximum, mean, and standard deviation of cathode width
  • Minimum, maximum, mean, and standard deviation of cathode end positions at the top and bottom of the cell
Image
How/where it is measured
  • Cylindrical cells: Measured within the jellyroll in every axial cross section
Why it matters
  • Cathode width can correlate to cell capacity and/or energy since the cathode serves as the lithium source in the cell
  • Cathode end positions close to the anode terminal can pose an internal shorting risk
  • Variation in cathode width and/or end position often indicates poor coating/winding control

Crimp

What we track
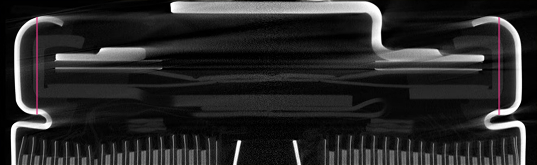
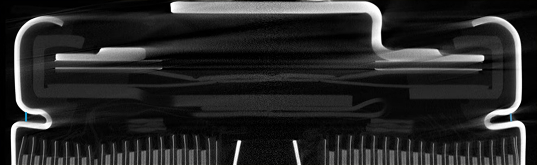
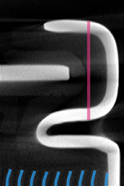
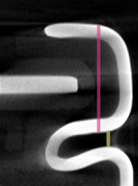
Minimum, maximum, and mean crimp height, measured a fixed distance (0.8 mm) from the crimp edge. Minimum, maximum, and mean crimp groove gap.
Image
Crimp height
Image
Crimp groove gap
How/where it is measured

Cylindrical cells:

Measured in the header region in every axial cross section
Note: The crimp groove gap measurement only applies to cells with a clearly defined narrow groove region. See the images below: the left image does not have a measurable groove gap, while the right image does.
Image
No measurable
groove gap
Image
Measurable groove gap
Why it matters
  • The crimp height and crimp groove gap are indicators of crimp quality, which impacts cell mechanical integrity, sealing quality, and abuse tolerance
  • Wide variability within a cell may indicate crimp deformation
  • Wide variability across cells may indicate a poorly-controlled crimping process
Image

Cases studies

Learn how our cell customers are using the Battery package.

View our case studies

Founded by cell quality experts

Built by cell engineers, for cell engineers

Glimpse's co-founders spent a combined 30 years in the Li-ion battery industry. Whether they were working for cell producers or electric vehicle makers, every time they faced a cell quality challenge, they systematically turned to the same technology for answers: X-ray CT scanning.

The Glimpse Portal Battery package was built to turn CT scanning from a low-volume, costly lab instrument into the world’s most powerful battery quality management solution.
Resources

CT for Battery Cells

Learn from our team of battery quality experts what CT can and cannot reveal in your cells, and why.
Learn more
Resources

Battery Quality Science Corner

Our published research on how cells fail and which defects matter.
Learn more
Resources

Scan On Demand for Battery Cells

The CT scanning service designed specifically for battery cell inspection.
Learn more

Trusted by

Serving technology leaders across all industries

Get started

See our inspection algorithms applied on 1,000+ battery cells